
2024 AGENCY CONTINGENCY PERFORMANCE CONTINUES DOWNWARD TREND WHILE P&C INDUSTRY REBOUNDS TO UNDERWRITING PROFITABILITY
Last year was another rough year for contingency bonuses. While the P&C Industry posted a combined loss ratio of 97.1% and many carriers started to get back to underwriting profitability (Chubb was the league leader with 86.6% combined ratio and $9B in net income), the hard market continued to linger, disrupting profit sharing for many agencies.
Typically, contingencies make up between 6-10% of an agency’s annual revenue and help pad the profitability margin. However, the hard market has delivered a blow to the contingency performance, and 2024 was no exception, as every agency category except one saw a drop in contingency bonuses.
Most agencies do not make it a practice to budget for contingencies and that has been a smart business practice as of late. As of now, 2025 is shaping up to be a much better year for contingency performance. Early projections have 2025 at a 98.5% and 2026 at 99% combined ratio. This would be a positive sign for agencies and should bear fruit in contingency performance, assuming your geographic area does not experience any CAT losses.
We will dive into some key indicators for agency contingency performance including the actual contingency results, loss ratio, and retention rate results.
AGENCY PERFORMANCE: CONTINGENCY
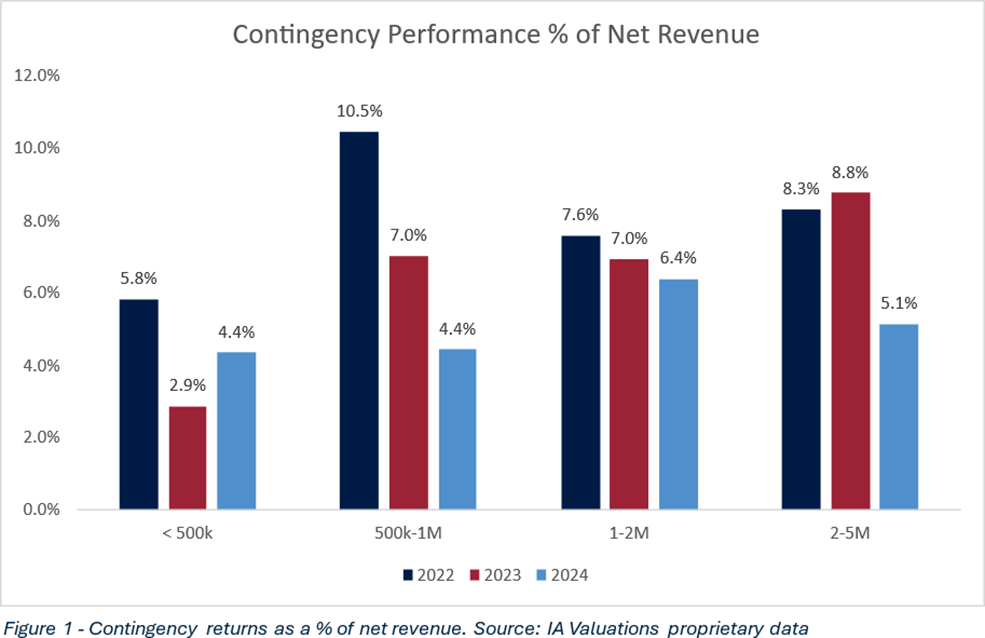
Contingency performance was down in 2024, as one might expect following a year like 2023 where nationally, a record 28 catastrophes caused $1B or more in losses. These contingency results reflect cash received in 2024, thus it is based on 2023 underwriting performance for agencies.
Revenue Group Performance Summary
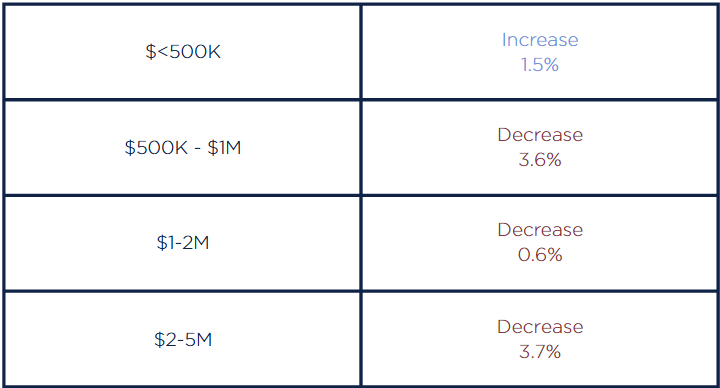
TAKEAWAYS FOR THE INDEPENDENT AGENT
Less than $500k – This group saw their contingent returns beat 2023 but still underperform 2022’s results. This was surprising as 2024’s results are based on 2023’s underwriting performance and the industry saw a $21.3B underwriting loss in 2023. The 1.5% increase was likely a regression to an average from the exceptionally low 2023 performance and likely reflects the performance of the small agency lead carrier profile.
$500k – $1M – This group matched the downward trend we expected to see. Interestingly, this group experienced the largest decline from 2022-2024 contingent results, dropping 6.1% over two years. Often, these agencies will have, on average, 2 carriers they have enough volume with to earn meaningful contingency. This concentration means volatility of contingent results is higher than larger revenue groups.
$1M – $2M – This group also experienced a downward trend, but with less of a decrease. They only have declined 1.2% over two years, averaging a 0.6% decrease per year. This revenue group is subject to less volatility as the number of carriers they receive profit sharing results is higher on average than the two lower groups.
$2M – $5M – This group experienced the largest decrease in contingent results from 2023-2024. They declined 3.7% YOY. We would anticipate this group’s volatility to not be as high due to its higher revenue size. However, a possible explanation that we’ve experienced to be true with these agencies is often there are multiple contingency earning carriers, but there is one lead carrier that can bring in as much as 7-8% of agency revenue single-handedly. This is where volatility exists for agencies in this revenue group.
AGENCY PERFORMANCE: WEIGHTED AVERAGE LOSS RATIO
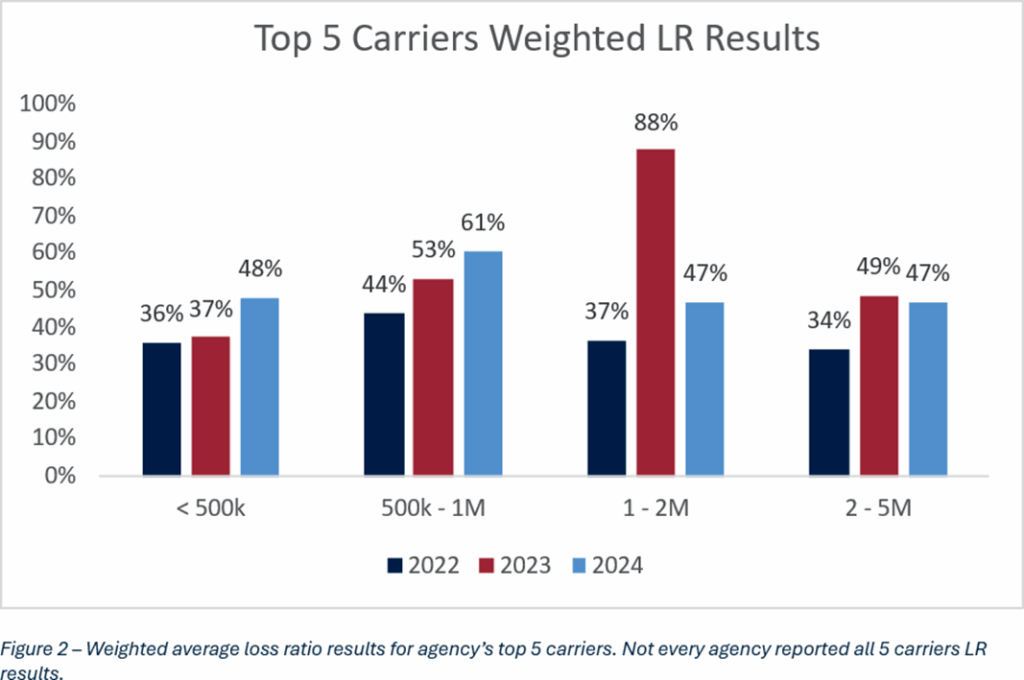
Revenue Group Performance Summary
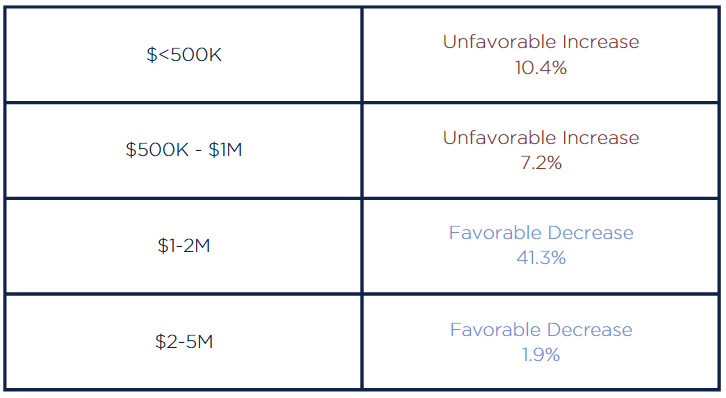
TAKEAWAYS FOR THE INDEPENDENT AGENT
Less than $500k – This group saw their weighted average loss ratio increase by 10.4% YOY. This matches what we would expect given the industry’s poor performance in 2023. It is important to spread business across multiple carriers to reduce the risk associated with one carrier’s underwriting practices. If you need more markets, strategically consider a market access program or agency network. However, please understand what it would cost you to exit one of these relationships prior to entering.
$500k – $1M – This group matched the upward trend we would expect to see. The loss ratio did not increase as much as the lower revenue group. This is likely due to the agency’s larger book. Increasing the number of policies and dollars of premium should decrease the volatility.
$1M – $2M – One of the eye-popping trends from this chart is agencies with $1 – $2M in revenue having so much volatility. Something unique about agencies in this revenue group is that, in this group, you start to see some very large accounts that are not as common in the smaller revenue groups. These accounts may single-handedly make up 5% or more of an agency’s revenue.
$2M – $5M – In this revenue group, we noticed some stability over the past 2 years, despite the very different industry underwriting performance between 2023 – 2024. Agencies of this size have a history of profitable business, thus how they’ve reached this revenue group. Their books are also well diversified with many accounts to counterbalance any “whales” they have on their books.
AGENCY PERFORMANCE: RETENTION RATIO
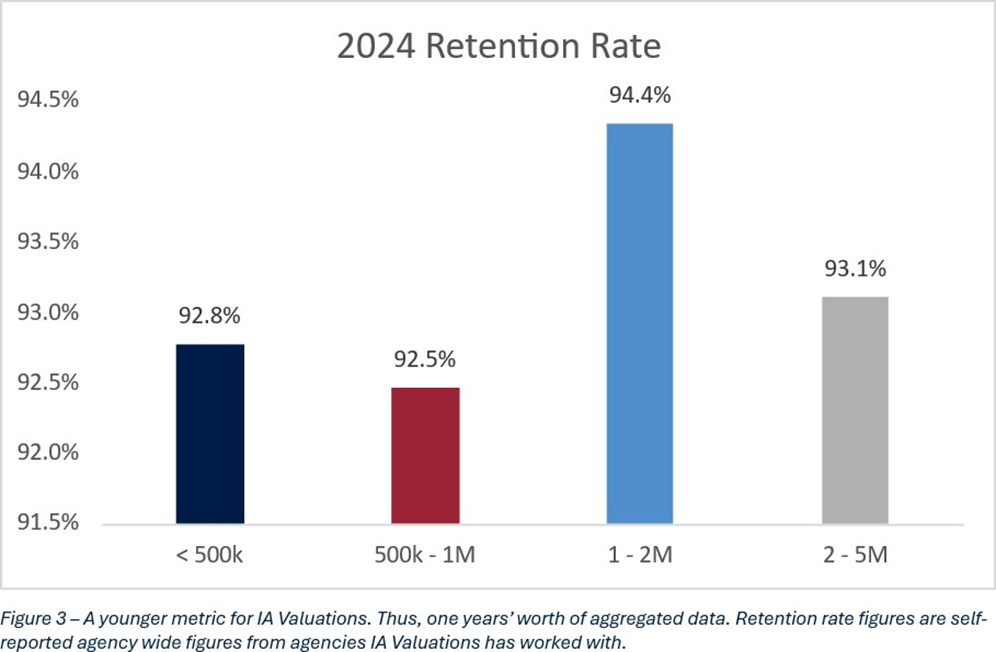
TAKEAWAYS FOR THE INDEPENDENT AGENT
Agencies are, on average, very good at retaining clients. To be an average agent today, you must have a retention that is in the low to mid 90%. If you are an agency with 85 – 90% retention, then you should expect this metric to be viewed as a tick against your agency in a fair market valuation analysis or by a potential buyer in the market.
Drivers of this high retention rate today include efficient internal operations, advisory versus transactional service, and an increasing mix of commercial lines business. Technology tools today can help agents identify the clients who have been touched the least to help them prioritize calls. By positioning yourself as a risk advisor versus a salesperson, you demonstrate more value to your clients. If done correctly, commercial lines should be very sticky. If you demonstrate intimate familiarity and expertise with your clients’ business, they will be less likely to look for a different risk advisor.
CONTINGENCY: WHAT DOES IT MEAN TO “NOT RELY” ON THEM?
“I was taught never to rely on contingencies.”
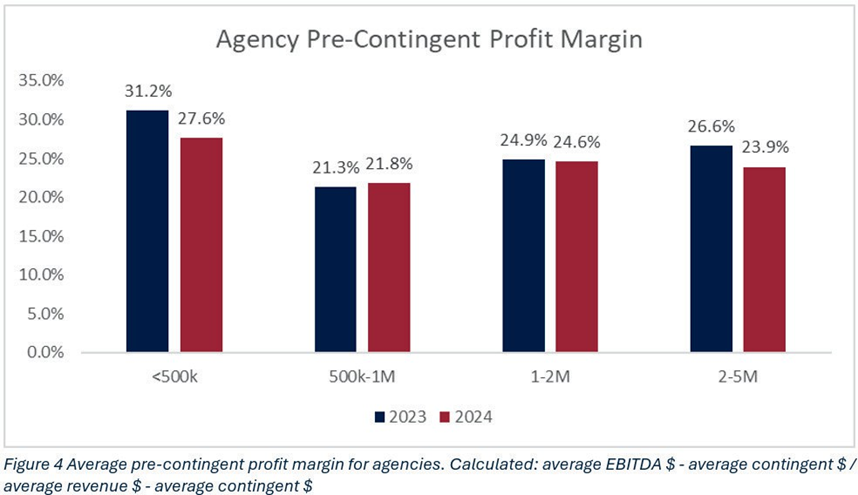
Many agents say this, but how do they put it into action and what does it really mean? Do they really practice that? Some agents may take this adage to mean that they won’t rely on contingents to break-even or they won’t rely on contingents to turn a 5% or 10% profit. According to IA Valuations, a valuable agency should budget for no less than 24.5% profit prior to contingent receipts to be truly non-reliant on contingent receipts.
On average, agencies that we value are not relying on contingencies to be profitable. this is a very strong indicator that agencies we work with are generally fiscally healthy. The results above further underscore this point.
As an agent, it is imperative that you treat contingency payments as a bonus, not as a necessity to turn a good profit. If you are budgeting for contingency receipts to return a profit, then you are likely a below average value agency.
The average pre-contingent profit across all revenue groups in 2024 was 24.5%. That is staggeringly strong and sets a great baseline target. In 2023, the average pre-contingent profit was 26%, even stronger than 2024, signaling that 24.5% is truly a baseline and a stretch goal for pre-contingent profit could be higher.
SO, HOW SHOULD AN AGENT BUDGET FOR CONTINGENCY?
Agency Revenue – When entering your agency’s annual budget planning, use this 24.5 – 26% range as a target EBITDA profit margin without including contingent receipts in your agency revenue.
Agency Expense – An agent should seek to operate in a manner where they are underwriting profitable business that returns 24.5 – 26% margin without the reward of contingency. By doing so, when an agent receives contingency payments, all those dollars will flow through to their bottom line.
Agency Profit– If we assume that every contingent dollar flows through to an agency’s bottom line, then that is just how we see agencies returning profits in the high twenties or low thirties, and this is just on average. No wonder private equity wants to be all over the insurance agent space.
WHAT CAN WE EXPECT FOR NEXT YEAR?
Next year at this time, IA Valuations would expect contingents as a percentage of revenue to increase across all revenue groups. This would reflect the industry underwriting gain in 2024. The property & casualty industry posted a $22.9B net underwriting gain in 2024, compared to a $21.3B underwriting loss in 2023. A swing of $44B will certainly trickle down to agencies.
Despite optimism about next year’s results, this does not change the target for valuable agencies. Valuable agencies are generating a 24.5 – 26% margin without contingent results. The average agency we value does not rely on contingents at all.
VALUATION VIEWS: PUBLIC SPACE REPORT
TAKEAWAYS FOR THE INDEPENDENT AGENT
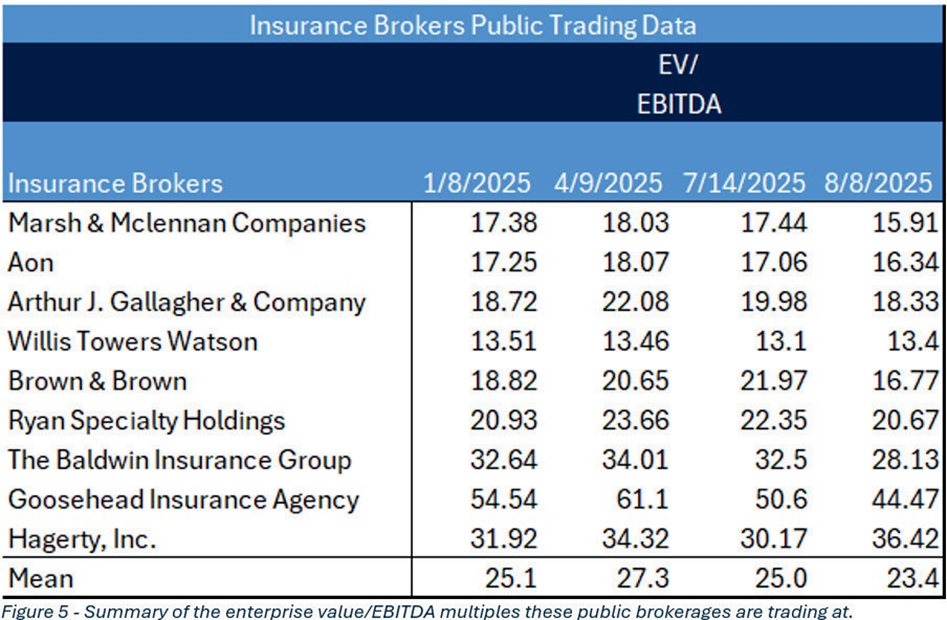
In the private sector M&A and agency valuation space, you will hear your agency talked about in terms of multiples of EBITDA. Multiples of EBITDA refers to the value of an agency divided by its EBITDA or cash flow. In the public sector, the closest comparison is the enterprise value to EBITDA ratio. Enterprise value takes into account a company’s market capitalization (outstanding shares x stock price), debt, and cash.
Why should the everyday agent care?
The public brokerages EV/EBITDA ratio sets the ceiling for agency values throughout the entire industry. After all, the people driving the public EV/EBITDA ratios are institutional investors and the rest of the market. So, as revenue sizes decrease, so does the EBITDA multiple that an agency would likely be valued at. You can see that some of the industry’s largest players are currently between a 13-18X EV/EBITDA ratio. For the average agency owner IA Valuations works with, you will find your average EBITDA multiple to be within 6-10X. This range of outcomes is partly dependent on what the public sector performance is.
By: IA Valuations
About IA Valuations and Agency Link – Founded in 2017, the IA Valuations team has performed over 270 valuations to independent insurance agencies across the U.S. Our advisors have 25+ years of experience guiding agency owners on maximizing their agency value, planning, and legal needs for ownership transition. In addition, IA Valuations has provided perpetuation planning, financial modeling and business planning for independent insurance agencies. Finally, IA Valuations has advised dozens of agency owners on selling their agencies through our Agency Link process. Agency Link is a platform that connects buyers and sellers together to further the growth and strength of the IA system. To learn more about IA Valuations, please visit IAValuations.com or contact@iavaluations.com.
The information provided in these documents is general in nature and shall not be construed as personal legal, tax or financial advice for your situation. Please contact@iavaluations.com to discuss your personal situation.
Copyright ©2025 by IA Valuations and Ohio Insurance Agents Association (OIA). All rights reserved. No portion of this document may be reproduced in any manner without the prior written consent of IA Valuations or OIA. In addition, this document may not be posted as a link on any public or private website without the prior written consent of IA Valuations or OIA.
Sources:
- https://www.insurancejournal.com/news/national/2025/02/21/812758.htm
- Chubb Limited Annual Report
- https://www.climate.gov/news-features/blogs/beyond-data/2023-historic-year-us-billion-dollar- weather-and-climate-disasters
- https://riskandinsurance.com/pc-insurance-posts-strong-2024-turnaround/
- LexisNexis 2025 US Auto Insurance Trends Report